Making Genomics Accessible
As human genetic data becomes more accessible, there is a need to provide insight into what this data means. Our tool provides an entry into medical genetic data. The total population is comprised of 1400 people, who belong to different sub-populations, like "British in England and Scotland", "Finnish in Finland", etc.
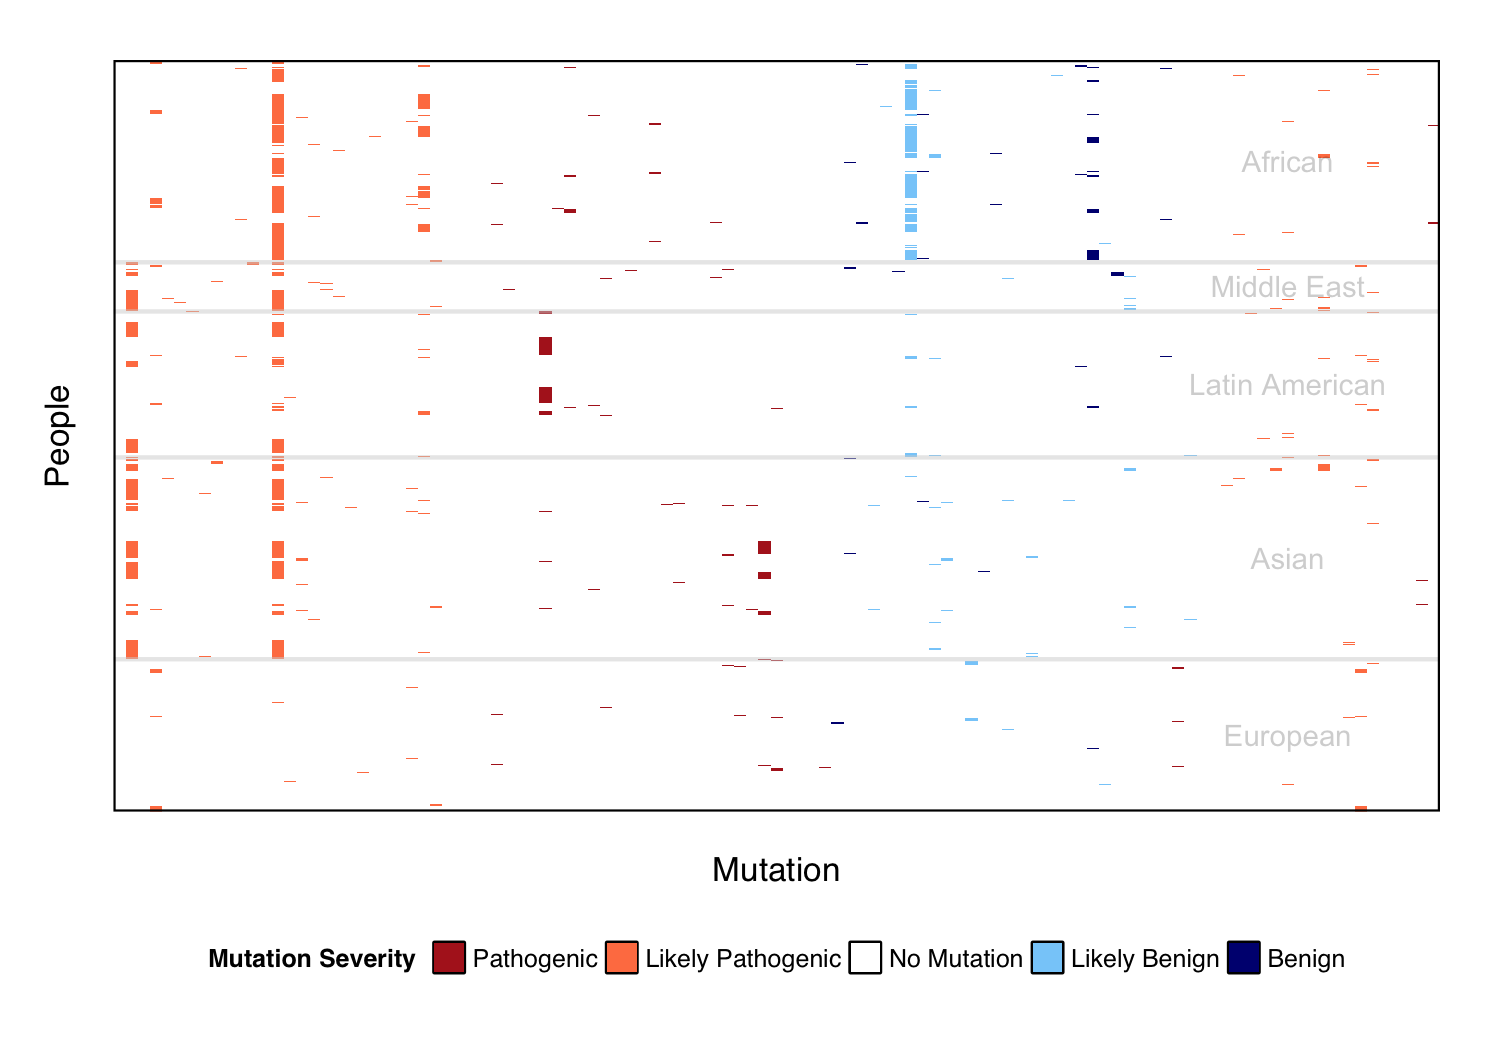
Population Level Choose a population
Mutations and thier associated diseases from the mitrochondrial genomes of 1400 people. Pathogenic mutations are red and benign are blue. Populations are clustered as larger ethnic groups, delimited by gray boxes.
Disease Level Select A Disease
A comparison of the prevalence of diseases within the selected sub-population with that of the total population is presented in the chart below. The x-axis represents the various diseases, while the y-axis represents the percentage of mutations. There are a total of 5112 mutations in the overall population of genomes in the data. As an example, 44.05% of the 5112 mutations in the overall population, and 35.93% of the 295 mutations for the GBR population are associated with breast cancer.
Hover on the bars to see the prevalence, or hover on the disease label to see the full disease name, or click on the bars or the disease label to find out more information about the disease.
Mutation Level Select A Mutation
From left to right, the tree below provides additional detail on genes and mutations related to your selected disease. Click on a colored node to see the mutations associated with that gene or click on the text of the disease/gene/mutation to get more information.